
An infographic is a powerful way to share information. It helps people understand complex topics quickly. But not all infographics are effective. Some are too crowded, while others do not catch the eye. Because of that, it is important to improve infographics in 2025. Also, a well-made infographic can attract more viewers, increase engagement, and make your brand look more professional. So, in this blog, we will talk about how to improve your infographic with useful tips, tools, and examples.
Infographic Trends Benefits of Infographics
Using infographics has many benefits. Here are some of the best reasons why you should use them:
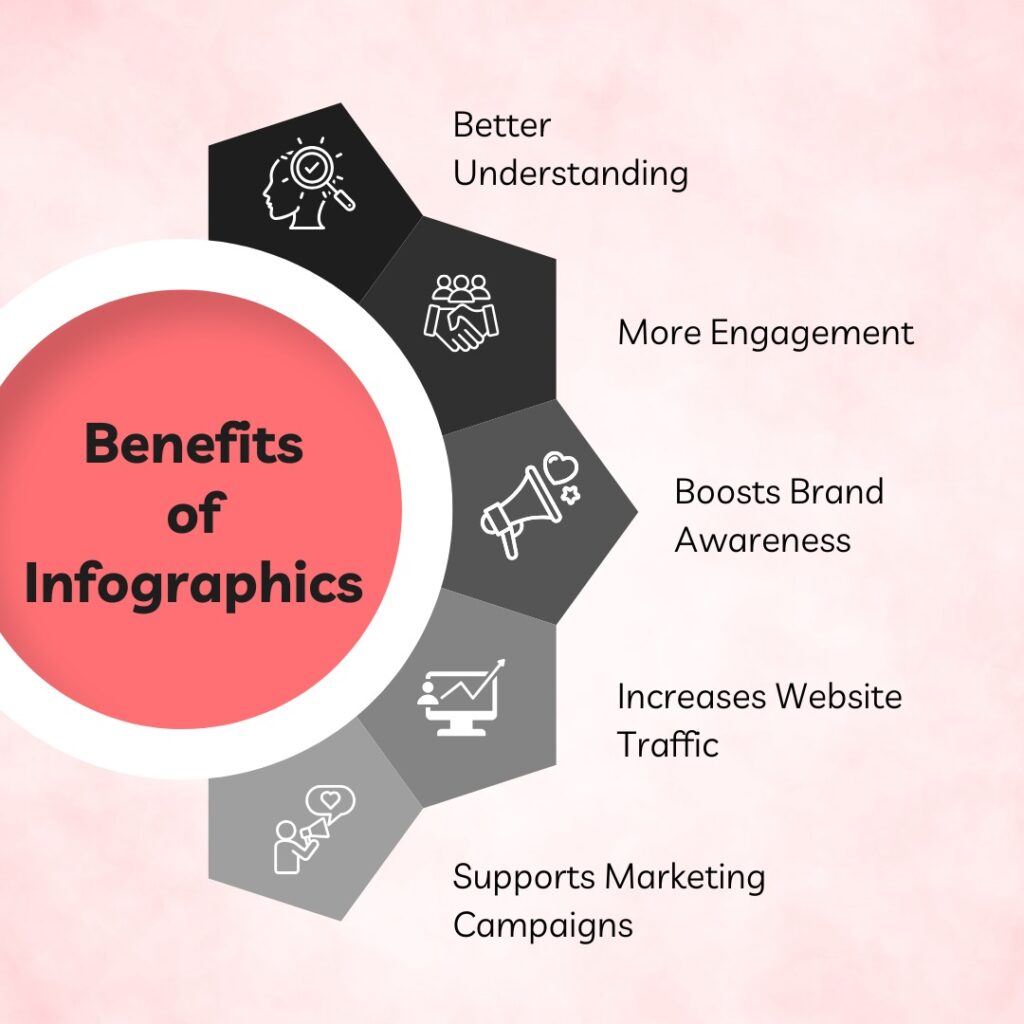
- Better Understanding
- People understand pictures faster than long text.
- If the topic is complicated, an infographic makes it simple.
- More Engagement
- Infographics catch the eye more than plain text.
- Because of that, people like to share them on social media and websites.
- Boosts Brand Awareness
- A well-designed infographic can help promote a brand.
- If you add a logo and brand colors, people will remember it.
- Increases Website Traffic
- If an infographic is shared on social media, it brings more visitors.
- Google also ranks visual content higher, which helps improve website traffic.
- Supports Marketing Campaigns
- Infographics work well for digital marketing and social media.
- They help brands explain products and services more clearly, which is great for a marketing campaign.
2025 Tips & Examples to Improve Infographics
If you want to create a good infographic, follow these simple tips.
- Use Simple and Clear Design
- Do not use too many colors, fonts, or images.
- Keep it clean and modern so it looks professional.
- Keep Text Short and Precise
- Use small sentences and bullet points to make it easy to read.
- If there are too many words, people might ignore it.
- Focus on One Message
- Do not put too much information in one infographic.
- Focus on one key message so the viewer can understand quickly.
- Use High-Quality Images and Icons
- Blurry or pixelated images make it look bad.
- Always use sharp, high-quality images.
- Add Data and Statistics
- Real numbers make the infographic more trustworthy.
- Also, always mention the source to build trust.
- Use a Color Theme
- Stick to 2-3 colors that match your brand.
- Too many colors can make it look messy.
- Test Different Layouts
- Try different placements of text, images, and icons.
- If something does not look good, adjust it.
- Make It Mobile-Friendly
- Many people view infographics on mobile phones.
- So make sure it looks good on all screen sizes.
Tools to Help with Your Infographics
Many tools can help you create and improve your infographic. Here are some of the best ones:

- Canva
- A simple and easy-to-use design tool.
- It offers free templates in the Canva image editor that make designing easier.
- Piktochart
- Let users create professional infographics quickly.
- It has a drag-and-drop feature that makes customization simple.
- Visme
- Perfect for businesses that need interactive infographics.
- Offers animation and customization options.
- Adobe Illustrator
- Best for graphic designers who need advanced tools.
- Allows full creative control over designs.
- Venngage
- Provides infographic design templates for marketing and business use.
- Easy to edit with different themes and icons.
FAQs
Many people have questions about making good infographics. Here are three common questions and answers:
- What size should an infographic be?
- It should be at least 600 pixels wide so that it is clear.
- For social media, a vertical format (800×2000 pixels) works best.
- Can I use free images in my infographic?
- Yes, you can use free stock images from sites like Unsplash or Pexels.
- But always check the image license before using.
- How do I make my infographic SEO-friendly?
- Use alt-text for images so search engines can read them.
- Add keywords in the title and description.
- Also, share it on multiple platforms to increase website traffic.
Conclusion
Improving your infographic in 2025 can help your brand grow and make your content more engaging. If you follow these tips, your designs will look better and attract more viewers. But if you need expert help, RPG Websolutions is here for you! We offer professional infographic design services that can make your content stand out. Contact us today, and let’s create amazing infographics together!
Leave a Reply